Net breakdown: GCL $95, ZS $166, 6E $66
| RESULTS FOR DAY | |
|---|---|
| Contracts: | 28 |
| Net $P/L: | 327 |
| Wins: | 20 |
| Losses: | 8 |
| Win%: | 71 |
| Avg$Win: | 37 |
| Avg$Loss: | -51 |
------------------------------------------
Crude is certainly wild and I wonder if it can be tamed enough to extract some profits in a very mechanical fashion. Of course the hedge funds and others that have access to top programmers do exactly that but with autobots that will always "click the mouse" faster than me any day and with no emotion.
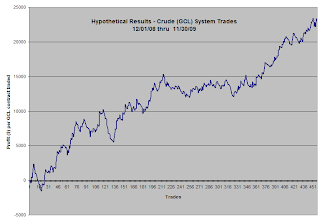
But having looked at the swings in crude, I had an idea for a system and I just completed backtesting every trade that would have occurred in the past year. Without getting deep into the entry details, it basically looks for an overbought or oversold condition and enters on a pullback. The exit details are simple but I would love some feedback from anyone who has studied various exit scenarios to see what might work better. No stops or targets are used after entry (yes I know a black swan could be trouble so an emergency stop could be set). Instead, the exit is a market order. Assuming a long position, the exit would be when the first of 2 conditions occur, 1) the closing print of a subsequent bar is above the high of the entry bar, or 2) the closing print of a bar is below the entry price.
Win% is only 33% and the average trade makes ~5 ticks, or $50 profit. I was more optimistic before I saw the couple near $5000 drawdowns that occurred earlier in the past year and know results can be improved but I don't want to over optimize and have never had much luck with fixed stops/targets or with trailing stops on such systems.
Hypothetical results are below. Commissions are included but no slippage. Slippage of 0-1 tick per trade would reduce results by up to 20%.


Questions emailed to me I thought I'd answer here...
ReplyDeleteQ: Did you create that equity chart manually trade by trade or do you automate a backtest?
A: Created manually in Excel by entering data for every trade and then charting it. Very time consuming...
Q: Are you trading signals off those smaller timeframes or just showing your trades on them?
A: I usually show a 1 or 2 min. chart when posting my fill charts since it's easier to see what's going on. I don't trade off them.